Point Cloud Editing Tutorial
Editing the attribute information on point clouds is an important step in LIDAR data processing and
complements automatic classification schemes such as object identification by machine learning.
This tutorial covers the aspects of manual corrections of point clouds (though by virtue of the
underlying fiber bundle data model, any kind of data can be handled same).
 To get started, download the data file
EditingTutorial.f5 (32MB)
for this tutorial (as available from the HydroVish Download Page.
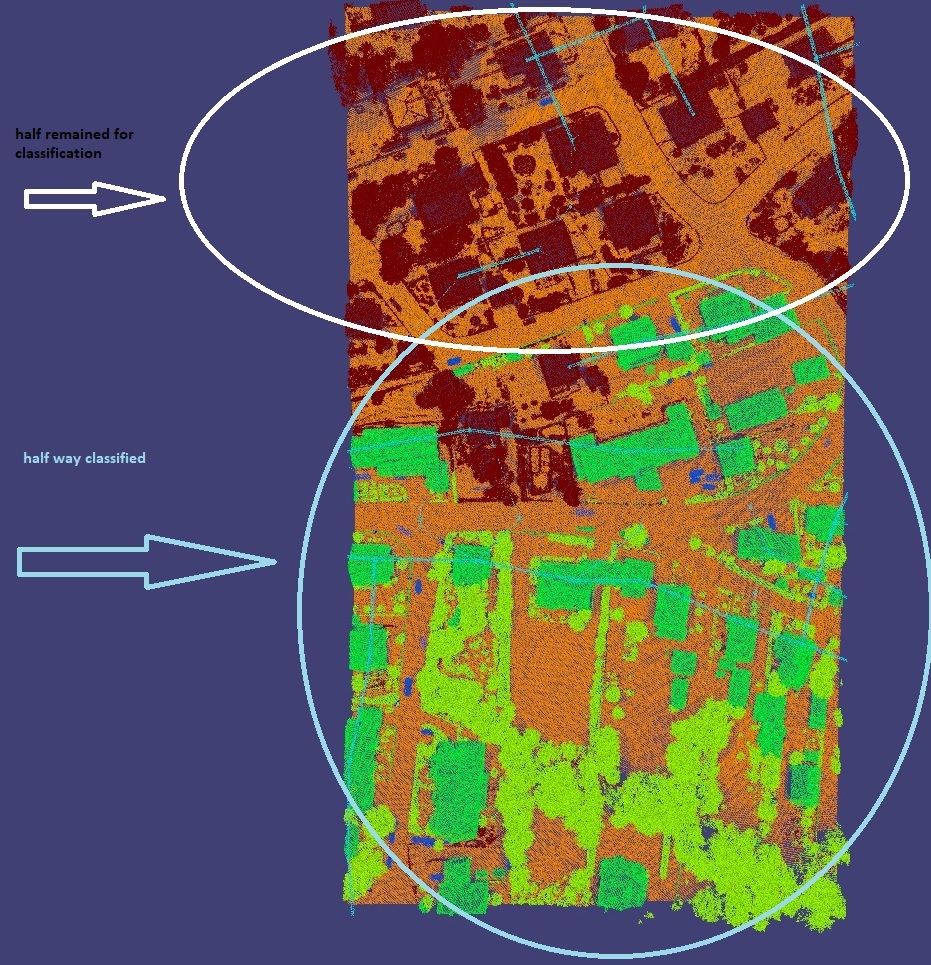
This file contains a partially classified point cloud.
Load this file into HydroVish, and extract a Grid as described in the
fiber bundle introduction.
You may now set up a visualization first, or proceed towards setting up editing right away
and set up the visualization afterwards.
To get started, download the data file
EditingTutorial.f5 (32MB)
for this tutorial (as available from the HydroVish Download Page.
This file contains a partially classified point cloud.
Load this file into HydroVish, and extract a Grid as described in the
fiber bundle introduction.
You may now set up a visualization first, or proceed towards setting up editing right away
and set up the visualization afterwards.
Setup Visualization
Select Display/HeightDots from the Grid and press the space key for centering the view.
Quick Step Instructions:
- Load File
- Use [F] button, create Grid object
- Use [D] button from the Grid object, create HeightDots visualization object
- Press space bar for centering the view.
|
Note that the HeightDots module will also create a Colormap module, which is used
for the default colorization of dots according to their height. This module can be hidden right away
such that it is out of view and does not clutter the network (just hide it, but don't delete it).
Use the mouse to navigate around for a pleasant view.
The size of the dots for this point cloud may be too large (but is a matter of personal taste).
To adjust them, increase the Expert Level setting of the HeightDots module to
1 by clicking on the right half of the expert level display frame, which shows "[0]" initially.
A "sizescale" parameter will show up. Set this to 0.2, or whatever looks appropriate.
Note that at any stage you can save the current visualization network to a script file,
preferably using the CTRL-S shortcut, such that settings can be restored from it.
Setup Labeling
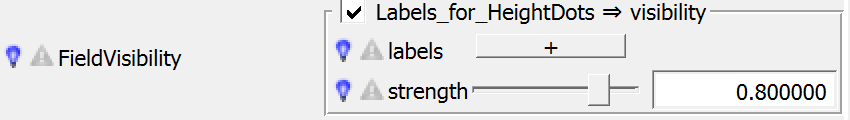
Go to expert level 2 in the HeightDots module and right-click on the input field
of the FieldVisibility, i.e. the red text there. Create Classification/Labels
via the context menu. Double click on the input name FieldVisibility such to expand
the input. This input field should then look like this:
Now, set up the various classes for the labeling, starting by clicking the [+] button to add
a new entry. Edit the text field for an arbitrary text, followed by the classification number
in parenthesis such as (34) to reference points with numerical attribute 34.
Right-click on this text field to edit the color associated with this class - any modification
will be visible immediatedly in the point cloud display.
The demo data set uses the following classes:
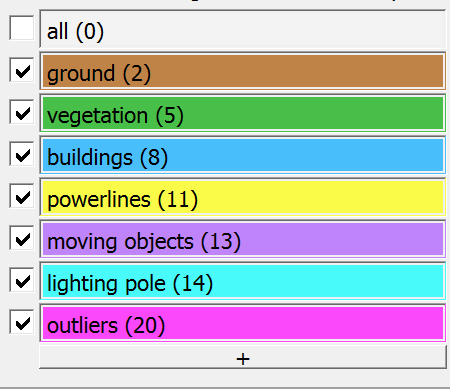
Of course, be welcome to use different colors and play with the various input parameters for the
HeightDots display module such to optimize the rendering according to personal taste.
It is recommended to safe the network frequently (CTRL-S) such to preserve a favorite setting.
Setup Editing
From the Grid object, extract the Fiber/Classification field.
From the newly created Classification field, create a Edit/MaskedLabels (available
from the Edit category button "✍").
Right-click on the labels input name of the newly created MaskedLabels and select
Attach Parameter from the context menu. It will provide one option directing to
=> Labels_for_HeightDots.labels.
Once this attachment has been established such that the MaskedLabels object has recognized
the same label set as input (double click the input name to see the labels also directly
within the MaskedLabels object),
it will display two more columns of input buttons to the right side:
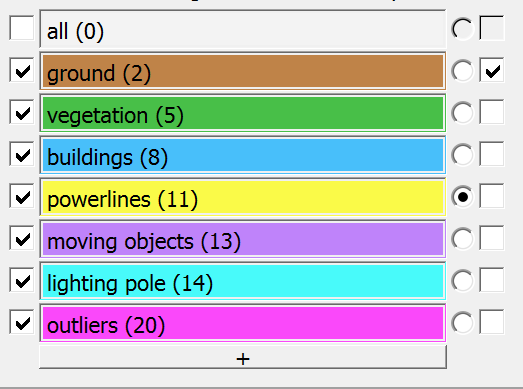
The first column of new button selects which class will be used when assigning values to points
(only one can be selected),
the second column of new buttons selects which classes are editable at all.
The visibility buttons on the very left side determine whether classes can be used at all;
points with inactive classes will be invisible and cannot be selected (however, if a class
is selected and marked editable, it will remain at this status even if later set to
inactive - it is left to the user to decide whether this mode of working is useful).
On the labels enable the "editing" property for those classes that may be modified,
and select one class that shall be used for assigning points.
Find the Lasso object in the network, an select free shape mode.
Click at the point cloud to draw the outline of a polygone for a shape
to be marked for editing. The top toolbar provides Undo/Redo buttons for the
drawing operation using the Lasso.
- free shape mode allows to modify the shape of a polygon.
- brush mode allows to apply an existing shape to the current
mouse position; clicking left mouse moves the polygon, keeping the left
mouse button down and moving the mouse drags the shape around.
- inactive mode re-enables the left mouse button for 3D navigation
Once a polygonal shape (the "Brush") looks satisfying, push the [Select]
button in the MaskedLabels object. All points that fit the editing criteria
will show up in bright red now.
Note that MaskedLabels's [select] button can be attached to
=> Lasso.finishAction - this setup is useful in conjunction with
Lasso's active mode.
Alternatively, MaskedLabels's [select] button can be attached to
=> Lasso.finishDrawing, which is useful if points shall be marked
right after drawing a polygonal outline.
Both actions may be repeated as much as needed, with
"Mask Undo" and "Mask Redo" buttons available under the toolbuttons,
as well as a "Clear Mask" button for clearance (cannot be undone).
Once the masking of the points looks fine, push the
[applySelection] button to actually change the classification information
for the point cloud. There are tool buttons for Undo/Redo of this operation as well.
Another setup is to attach MaskedLabels's [applySelection] button
to => Lasso.finishDrawing, which allows to immediately modify the points
from drawing the selection outline.
Practical Remarks
For an overview of all VISH help topics see the Table of Contents.